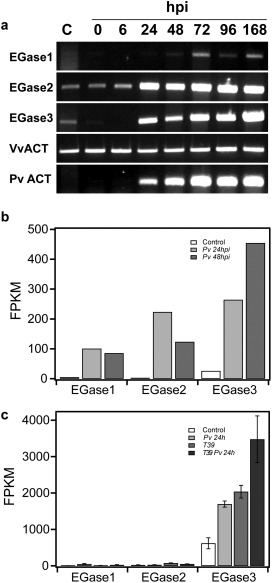
Figure 2.

Expression of grapevine endoglucanases on Plasmopara viticola infection. (a) Semi‐quantitative reverse transcription‐polymerase chain reaction (RT‐PCR) showing the expression of grapevine endo‐β‐1,3‐glucanases (EGases) at 0, 6, 24, 48, 72, 96 and 168 h post‐inoculation (hpi). Non‐inoculated leaves were used as control (C). PvACT, Plasmopara viticola actin; VvACT, Vitis vinifera actin. The results are representative of two independent experiments. (b) Expression of EGases on grapevine leaves based on RNA‐Seq data from Vannozzi et al. (2012). Pv 24hpi, P. viticola‐infected leaves at 24 hpi; Pv 48hpi, P. viticola‐infected leaves at 48 hpi; FPKM, fragments per kilobase of exon per million fragments mapped. (c) Expression of EGases on grapevine leaves based on RNA‐Seq data from Perazzolli et al. (2012). Pv 24h, P. viticola‐infected leaves at 24 hpi; T39, leaves treated with Trichoderma harzianum T39, which induces resistance to downy mildew; T39 Pv 24h, P. viticola‐infected leaves following treatment with T39 at 24 hpi; FPKM, fragments per kilobase of exon per million fragments mapped. Data shown are the means and standard errors of three biological replicates.
