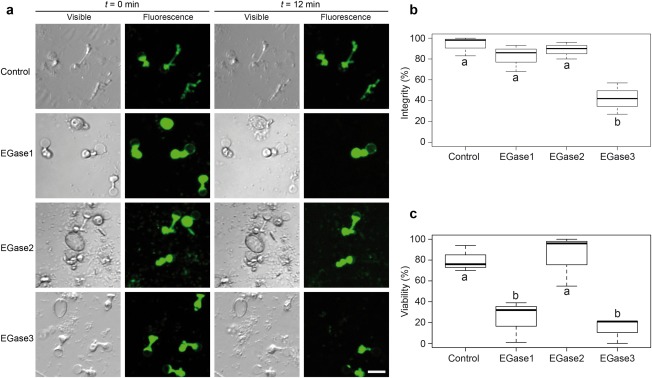
Figure 6.

Effect of endoglucanases on germinated Plasmopara viticola spores. (a) Glucanase assay on P. viticola germinated spores. Each line represents a different treatment, where purified endo‐β‐1,3‐glucanases (EGases) or buffer as control were added to the spore suspension. The results of each treatment are illustrated by a photograph of the same microscopic field taken at different times (t = 0 min and t = 12 min) under two different light sources. Fluorescent light reveals fluorescein diacetate (FDA) fluorescence and indicates live zoospores, whereas visible light allows the counting of structurally intact zoospores. The effect on spore viability can be observed for all three EGases (fluorescence panels). The effect of treatment on spore integrity is visible for EGase3. Bar represents 15 µm. (b) Percentage of spores showing structural integrity after 12 min of treatment. Percentages were calculated by counting spores at t = 0 min and t = 12 min in visible light. (c) Percentage of spore viability after 12 min of treatment. Percentages were calculated by counting spores at t = 0 min and t = 12 min in fluorescent light. In (b) and (c), boxplots show the results of three independent experiments without technical repetitions. Boxes with the same letter are not significantly different in a Tukey's honestly significant difference (HSD) test at P = 0.05. Raw data for spore counting are detailed in Table S2.
