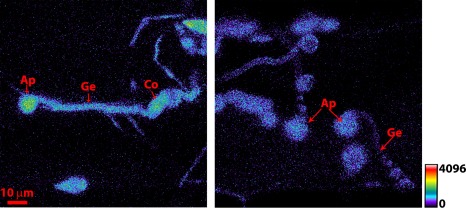
Figure 5.

Appressorium formation on the barley leaf surface at 21 h post‐inoculation. (a) Magnaporthe oryzae harbouring MoHyPer detected H2O2 levels in appressoria. (b) Autofluorescence from wild‐type 4091‐5‐8 conidia. As shown by the scale bar, warmer colours indicate increased levels of H2O2. Scale bar = 10 µm for both images. Ap, appressorium; Co, conidium; Gt, germination tube.
