
Figure 7.
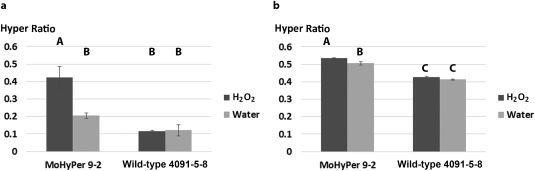
MoHyPer can be used for H2O2 level quantification. Ratios were significantly higher in the HyPer9‐2 strain. (a) Values were obtained through confocal images (2 mm H2O2 was applied); green and blue channel intensities were divided in order to obtain ratios. (b) Values were obtained directly from the plate reader (3 mm H2O2 was applied). Letters indicate significance level at P < 0.05. The y‐axis indicates the ratio taken by dividing the reading from the green channel by that from the blue channel.