
Figure 2.
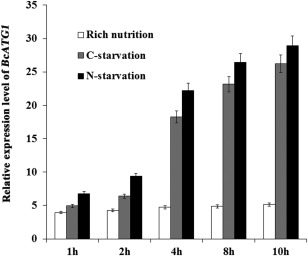
Expression levels of BcATG1 during carbon or nitrogen starvation. Relative expression levels of BcATG1 were calculated by quantitative real‐time polymerase chain reaction (qRT‐PCR). The total RNAs of the wild‐type samples were collected at the time points indicated in the graphs. Expression levels were normalized to the control gene Actin. The indicated values correspond to the means of three biological replicates; the bars represent the standard error of biological variation.