Figure 5.

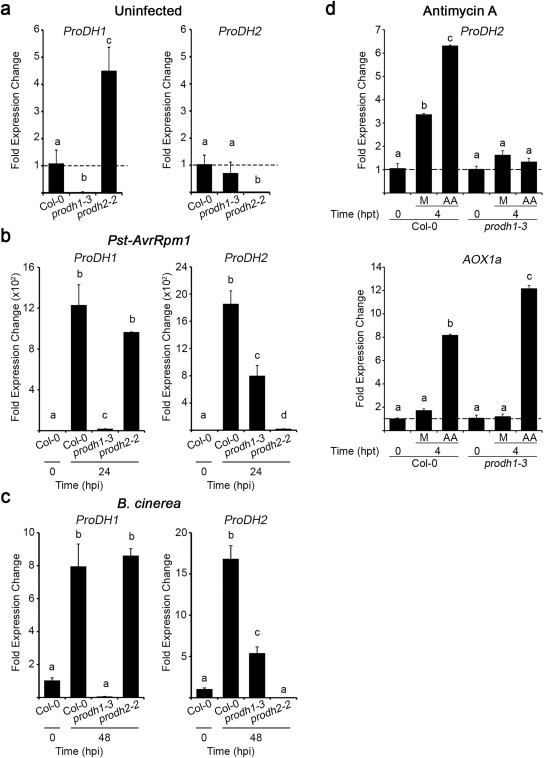
Inter‐regulation of ProDH1 and ProDH2 expression. Transcripts were quantified in Col‐0, prodh1‐3 and prodh2‐2 leaves at basal (uninfected) conditions (a), at 24 h post‐inoculation (hpi) with Pseudomonas syringae pv. tomato (Pst)‐AvrRpm1 [107 colony‐forming units (cfu)/mL] (b) or 48 hpi with Botrytis cinerea (six spots of 5 µL with 105 conidia/mL per leaf) (c). ProDH2 and AOX1a (alternative oxidase) expression in Col‐0 and prodh1‐3 tissues treated with antimycin A (AA, 10 µm) for 4 h (hpt, h post‐treatment) (d). Gene expression levels were determined by quantitative reverse transcription‐polymerase chain reaction (qRT‐PCR), applying the ΔΔCt method relative to each gene transcript level in Col‐0 at 0 hpi (a–c) or Col‐0 or prodh1‐3 at 0 hpi (d). Bars represent average ± standard deviation of three replicates. UBQ5 was used as a housekeeping gene. In each case, one representative of three independent experiments is shown. Different letters indicate significant differences among samples (P < 0.05 in a–c and P < 0.01 in d; t‐test).
