Figure 6.

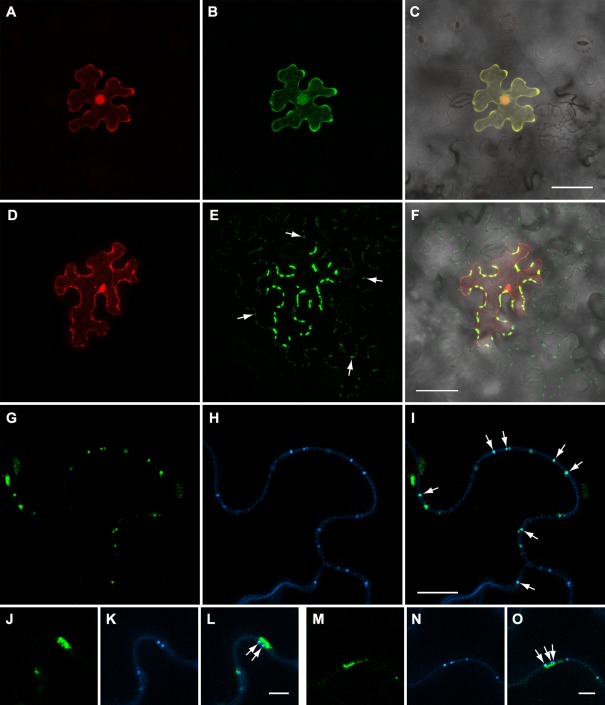
BMB2‐directed transport of BMB1 to plasmodesmata (PD) and neighbouring cells. (A–C) Epidermal cell expressing GFP‐BMB1 and mRFP in a leaf agroinfiltrated at low bacterial culture density with GFP‐BMB1//mRFP, a vector with two expression cassettes, to ensure agrotransformation of individual cells located distantly from each other. (D, E) Epidermal cell of a leaf co‐agroinfiltrated with GFP‐BMB1//mRFP at low bacterial culture density and the BMB2 construct at high culture density. (F) Merged (D) and (E) images superimposed on a bright‐field image to show the localization of GFP‐BMB1 along the cell walls of cells surrounding the primary cell. Arrows in (E) point to some of the discrete sites of GFP‐BMB1 localization in cells adjacent to the primary cell. (G–O) Callose staining with aniline blue in leaves co‐expressing GFP‐BMB1//mRFP and BMB2. (G–I) Cell walls between secondary cells are shown; arrows point to co‐localization of the GFP‐BMB1‐containing sites in cell walls with stained callose deposits. (J–O) Cell wall‐embedded BMB1‐containing punctate bodies located in close proximity to elongated membrane bodies and co‐localized with stained callose (shown with arrows). (J–L) Images taken for a primary cell. (M–O) Images taken for a secondary cell. Images in (A–F) are reconstructed from Z‐series of optical sections. Images in (G–O) represent single optical sections. Scale bars: (C, F) 50 μm; (I) 10 μm; (L, O) 5 μm. BMB, binary movement block; GFP, green fluorescent protein; mRFP, monomeric red fluorescent protein.
