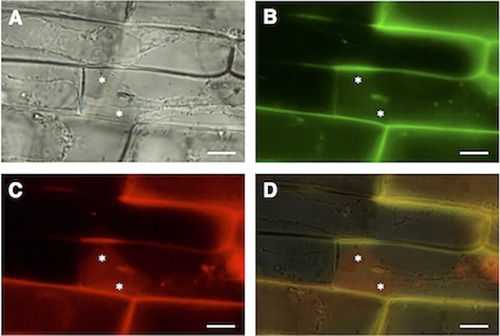
Figure 8.

Translocation of AVR‐Pia and PWL2 in the plasmolysed cytoplasm of Magnaporthe oryzae‐infected rice sheath cells at 61 h post‐inoculation (hpi). Asterisks, plasmolysed and concentrated rice cytoplasm. Scale bars, 10 μm. (A) Bright‐field image. (B) Green enhanced green fluorescence protein (eGFP)‐labelled AVR‐Pia fluorescence. (C) Red monomeric red fluorescent protein (mRFP)‐labelled PWL2 fluorescence. (D) Merged bright‐field, eGFP::AVR‐Pia (green) and mRFP::PWL2 image (red) images.
