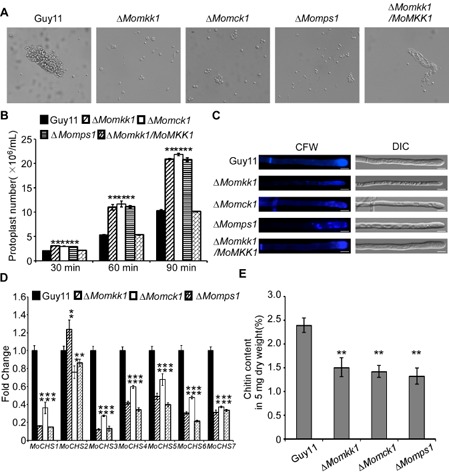
Figure 5.

ΔM omkk1 mutant shows defects in cell wall integrity. (A) Light microscopic examination of protoplast release after treatment with cell wall‐degrading enzymes for 45 min at 30 °C. (B) Protoplast release assay. Asterisks indicate significant differences between the ΔM omkk1 mutant and the wild‐type strain at P < 0.01. (C) Deletion of MoMKK 1 altered the distribution of chitin in the cell wall. Wild‐type and mutant hyphae were stained with 10 μg/mL Calcofluor white (CFW) for 5 min without light before being photographed. The experiment was repeated several times with triple replications that yielded similar results. Scale bar equals 5 μm. DIC, differential interference contrast. (D) Transcription analysis of seven chitin synthases in M agnaporthe oryzae using quantitative reverse transcription‐polymerase chain reaction (qRT‐PCR). (E) N‐Acetylglucosamine (GlcNAc) determination by the fluorimetric Morgan–Elson method showed significantly decreased chitin content in the ΔM omkk1 mutant. Asterisks indicate significant differences between the mutant and wild‐type strains at P = 0.01 according to Duncan's range test. Data represent three independent experiments, each performed three times.
