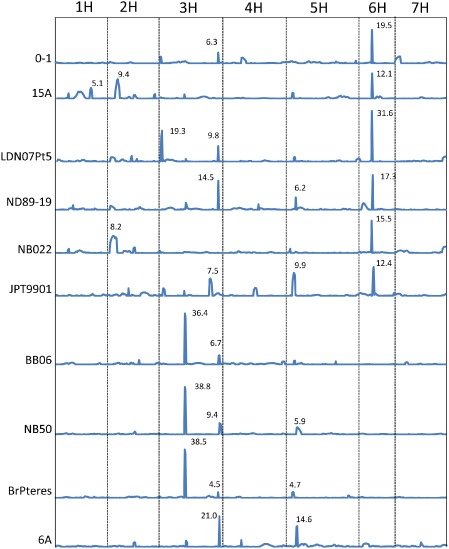
Figure 6.

The location of quantitative trait loci (QTLs) associated with disease reaction to each isolate. Composite interval mapping of seven chromosomes was provided to show the location of all the significant QTLs with logarithm of the odds (LOD) > 4.5 (α = 0.05). The LOD value for each QTL is indicated by the number adjacent to the QTL peak.
