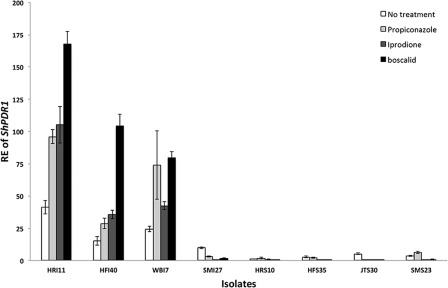
Figure 2.

Relative expression (RE) of ShPDR1 in the initial panel of eight isolates from five sites in New England in the absence and presence of propiconazole (0.1 μg/mL), iprodione (1 μg/mL) and boscalid (10 μg/mL) for 1 h. All bars (white, constitutive RE; light grey, propiconazole‐induced RE; dark grey, iprodione‐induced RE; black, boscalid‐induced RE) represent mean RE values. Error bars indicate one standard error of the mean. Isolates with an ‘I’ indicate propiconazole insensitive and with an ‘S’ represent propiconazole sensitive.
