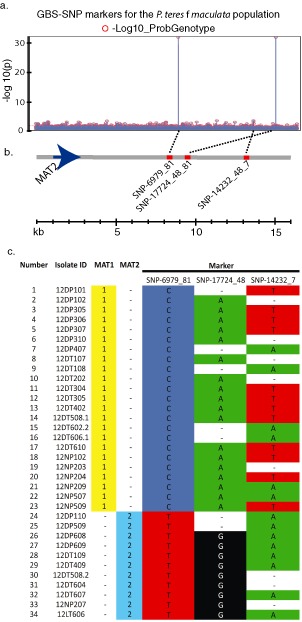
Figure 3.

Data validating the polymerase chain reaction‐genotype‐by‐sequencing (PCR‐GBS) data for association mapping of the mating type gene in the Pyrenophora teres f. maculata natural population. (a) Manhattan plot showing significant marker trait associations (MTAs) between the 16 441 GBS‐single nucleotide polymorphisms (GBS‐SNPs) and the mating type trait using a general linearized model approach in JMP Genomics. (b) The physical sequence at the mating type locus showing significant MTAs in relation to the mating type 2 gene (MAT2). The grey horizontal line represents the sequence from the mating type locus of P. teres f. teres with the blue arrow depicting the MAT2 gene and the red bars showing the relative position of the significant SNP markers. The broken black lines show where the MTAs for the specific markers are located on the Manhattan plot above. (c) A graph showing the correlation of the genotypes of all 24 isolates for mating type and significant markers. Mating type and SNP markers are perfectly correlated for markers SNP‐06979_81 and SNP‐17724_48.
