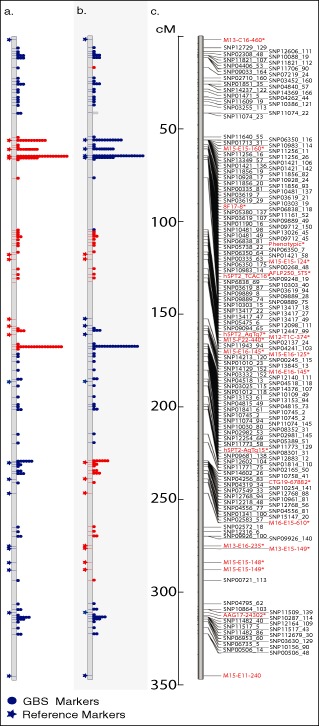
Figure 4.

Linkage group 1 from the genetic map developed using the biparental population created from the cross between Pyrenophora teres f. teres isolates 15A and 0–1. (a, b) Individual progeny lines with genotype indicated by colour: red is 15A and blue is 0–1. The stars to the left of the vertical grey bar indicate the genetic position and genotype of anchored simple sequence repeat (SSR) and amplified fragment length polymorphism (AFLP) markers. The dots to the right of the vertical bars indicate the position and number of restriction‐associated DNA‐genotype‐by‐sequencing (RAD‐GBS) single nucleotide polymorphism (SNP) markers positioned from the data generated with the protocol described here. A transition in colour indicates the region delimiting a recombination event in the specific progeny line. (c) Genetic map containing the GBS SNP markers with SNP markers in black and anchored SSR and AFLP markers in red. The scale corresponding to all three maps is in centimorgans (cM).
