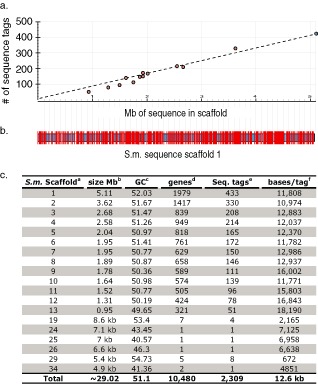
Figure 5.

Alignment of 434 genotype‐by‐sequencing (GBS) single nucleotide polymorphism (SNP) markers to the JGI Septoria musiva (Scaffold 1; ∼5.1 Mb) sequence assembly. (a) The graph shows the distribution of all 2309 sequence tags containing informative SNPs across the 13 largest S. musiva scaffolds ranging from 0.95 to 5.1 Mb. The x‐axis is the Mb of sequence in the sequence scaffold and the y‐axis is the number of sequence tags containing informative SNPs. The dots represent the 13 major scaffolds in the S. musiva genome assembly. The blue dot represents the largest (5.1 Mb) scaffold used for analysis in Fig. 1b. (b) The horizontal blue/black bordered bar represents the 5.1‐Mb S. musiva genome Scaffold 1 sequence from the JGI database (http://genome.jgi‐psf.org/Sepmu1/Sepmu1.info.html). The vertical white lines show the position of missing sequence between contigs within the scaffold. The red vertical lines show the positions of the 433 GBS ‘sequence tags’ containing informative SNPs. (c) Table showing the alignment of GBS sequence tags containing SNPs to the S. musiva genome sequence. aScaffold numbers from the JGI website (http://genome.jgi‐psf.org/Sepmu1/Sepmu1.info.html). bSize of sequence scaffolds given in megabases unless designated by kb (kilobases). c GC content of designated sequence scaffolds. dNumber of predicted genes present on sequence scaffold. eNumber of sequence tags aligning to scaffold. fNumber of nucleotide bases per sequence tag marker.
