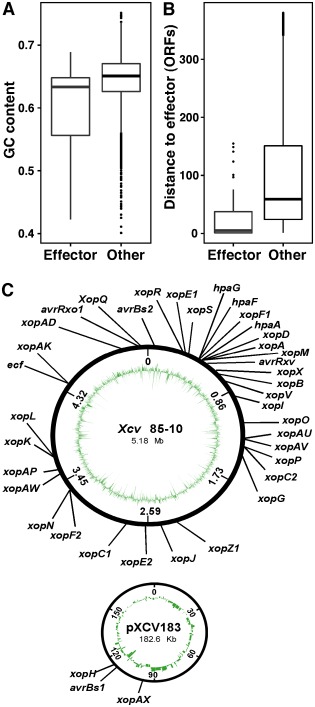
Figure 4.

Comparison of GC content and genome organization between effectors and non‐effectors. (A) GC content distribution of effectors vs. non‐effectors. The box represents the 25th and 75th percentiles and the bold line within the box is the median. (B) Distribution of the distance in open reading frames (ORFs) to the closest effector on the genome. (C) Localization of the effectors in the X cv 85‐10 chromosome and plasmid. The inside circles represent the GC content.
