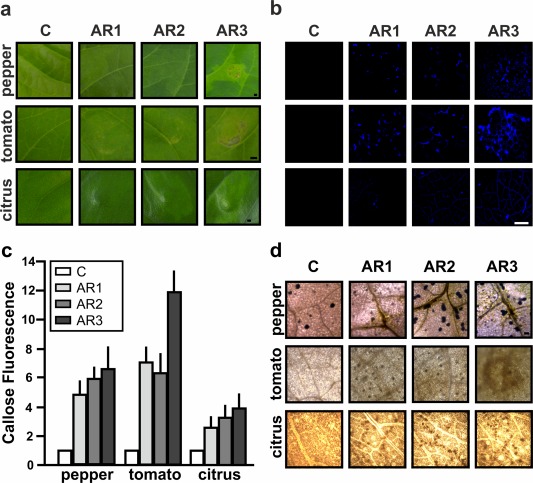
Figure 4.

Analysis of the response in pepper, tomato and citrus leaves infiltrated with Adhesin Regions (ARs) AR1, AR2 and AR3. (a) Representative photographs of the responses at 1 day post‐infiltration (dpi) with 5 µm AR1, AR2 and AR3. Bar indicates 1 mm. (b) Representative fluorescence microscopy photographs of aniline blue staining of callose deposition in pepper and tomato leaves at 6 h post‐infiltration (hpi) and citrus at 16 hpi. Bar indicates 20 µm. (c) Relative callose fluorescence intensities were quantified as described in Experimental procedures. Values represent means standardized to the mean callose intensity in control‐treated leaves. Error bars indicate standard deviations. The results are representative of three independent experiments. Results were analysed by one‐way analysis of variance (ANOVA) (P < 0.05). (d) Representative optical microscopy photographs of 3,3′‐diaminobenzidine (DAB) staining in pepper, tomato and citrus leaves infiltrated with the three XacFhaB regions (1 hpi in pepper and tomato and 6 hpi for citrus leaves). Bars indicates 1 mm. In all cases, 6×His‐Trx was used as a control (C).
