
Figure 7.
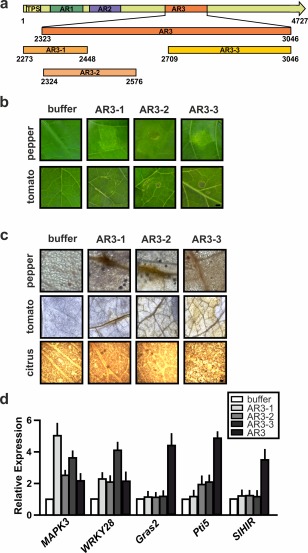
Analysis of the responses in tomato leaves infiltrated with Adhesin Regions (ARs) AR3‐1, AR3‐2 and AR3‐3. (a) Schematic representation of XacFhaB AR3 subregions. Numbers indicate amino acids in the full‐length protein. (b) Representative photographs of the responses at 1 day post‐infiltration (dpi) of 5 µm AR3‐1, AR3‐2 and AR3‐3 in tomato and pepper. (c) 3,3′‐Diaminobenzidine (DAB) detection of H2O2 accumulation in tomato leaves infiltrated with AR3‐1, AR3‐2 and AR3‐3 at 1 dpi. Representative optical microscopy photographs of DAB staining of leaves. Bars indicate 1 mm. (d) Real‐time quantitative reverse‐transcriptase polymerase chain reaction (RT‐qPCR) of tomato genes related to the defence response. Bars indicate the expression levels relative to control of the genes from RNA extracted from leaves infiltrated with AR3 and AR3 subregions at 6 h post‐infiltration (hpi). Values are the means of four biological replicates with three technical replicates each. Error bars indicate standard deviations. Results were analysed by one‐way analysis of variance (ANOVA) (P < 0.05).