Figure 1.

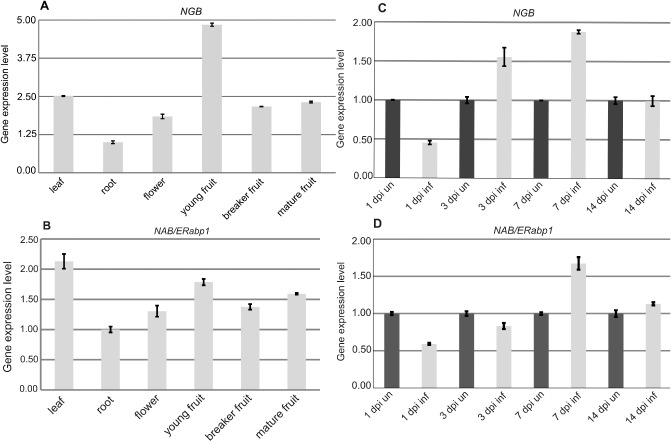
Real‐time reverse transcription‐polymerase chain reaction (RT‐PCR) analysis of expression profiles of NGB (A, C) and NAB/ERabp1 (B, D) in different organs of uninfected tomato plants (A, B) and tomato roots infected with Globodera rostochiensis (C, D). Expression levels of NGB and NAB/ERabp1 were quantified with reference to the expression of 18S rRNA. Gene relative expression levels are shown as fold changes in comparison with the copy number of a particular mRNA in a control sample that was arbitrarily assigned a value of unity. Results presented are means (± SE) from three independent experiments.
