
Figure 2.
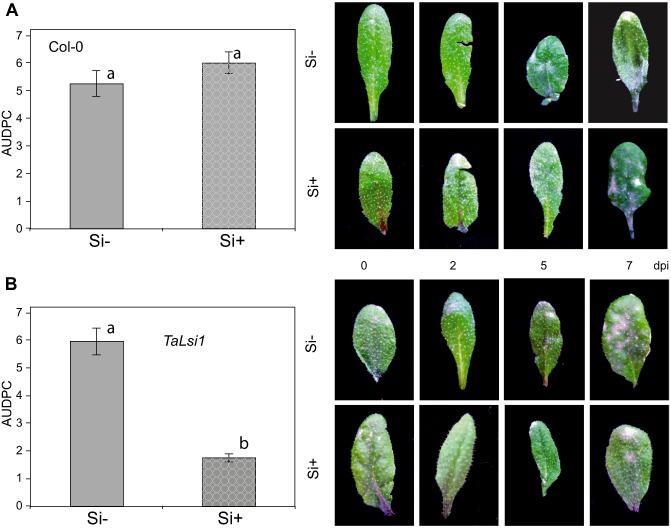
Powdery mildew (Golovinomyces cichoracearum) development and severity expressed as the area under the disease progress curve (AUDPC) over 7 days post‐inoculation (dpi) on Arabidopsis plants in response to silicon (Si) treatment. AUDPC on Col‐0 (A) and TaLsi1 (B) plants grown with (Si+) or without (Si–) Si and typical phenotypes over 7 days. Values represent the means ± standard error (SE) of nine biologically independent experimental units. Means with different letters are statistically significantly different based on a t‐test (α = 0.05).