
Figure 3.
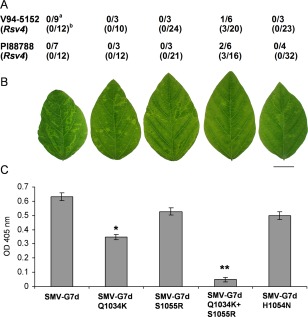
(A) Virulence of SMV‐G7d and its derivative P3 mutants on Rsv4‐genotype soybeans inoculated biolistically with infectious cDNA clonea or mechanically with infectious sap derived from biolistically inoculated Essex (rsv4)b; the number of plants systemically infected/number of plants inoculated is shown (Wang et al., 2015). (B) Systemic symptoms on central leaflets from trifoliate leaves of soybean cv. Essex (rsv4) inoculated mechanically on unifoliate leaves with progeny viruses derived from cDNA clones. Plants were maintained in a growth chamber at 22°C until being photographed at 21 dpi. Scale bar, 2 cm. (C) Comparison of accumulation level of viruses relative to SMV‐G7d in systemically infected trifoliate leaves of soybean cv. Essex (rsv4) by enzyme‐linked immunosorbent assay (ELISA). Plants were inoculated and maintained as in (B) until central leaflets from four fully developed trifoliate leaves of the inoculated plants were harvested at 21 days post‐inoculation (dpi) and analysed. Each bar represents the mean value of virion accumulation from two independent experiments, each with four replicate plants, with the standard errors indicated. Significant differences between the mean values for SMV‐G7d and each of its derivative P3 mutants were determined using Kruskal–Wallis test [non‐parametric statistical method from Data Processing System software (Tang and Zhang, 2013)] and are indicated by single (P < 0.05) or double (P < 0.01) asterisks. OD, optical density; SMV, Soybean mosaic virus.