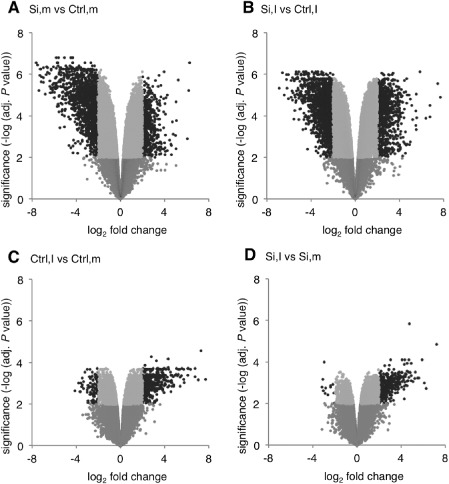
Figure 4.

Volcano plots showing gene expression changes and associated significance values across the different treatment comparisons. Each array spot is represented by a single dot. Black dots represent differentially expressed genes [–2 > log2‐based signal ratio > 2 and −log10(P value) > 2]. Si, silicon; Ctrl, control; I, inoculated; m, mock‐inoculated.
