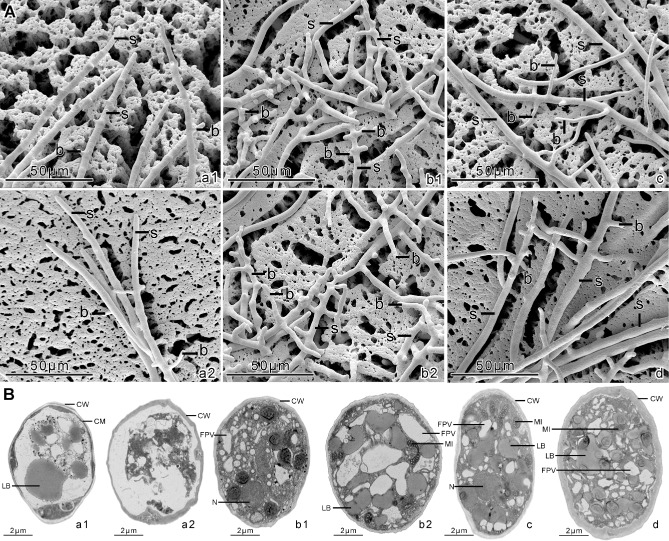
Figure 6.

Ultrastructure of sporangia and hyphae in PcSDA1‐silenced and overexpression lines. (A) Scanning electron microscopy of the sporangiophores; b, branches on sporangiophores; S, sporangiophores. (B) Transmission electron microscopy of the sporangia; CW, cellular wall; FPV, vacuoles; LB, lipid bodies; MI, mitochondrion; N, cellular nuclei. a1, silenced line SiPcSDA1‐3; a2, silenced line SiPcSDA1‐4; b1, overexpression line OPcSDA1‐1; b2, overexpression line OPcSDA1‐2; c, CK (empty vector transformant); d, wild‐type strain SD33. Each experiment was repeated at least four times on independent occasions, and typical structures are shown.
