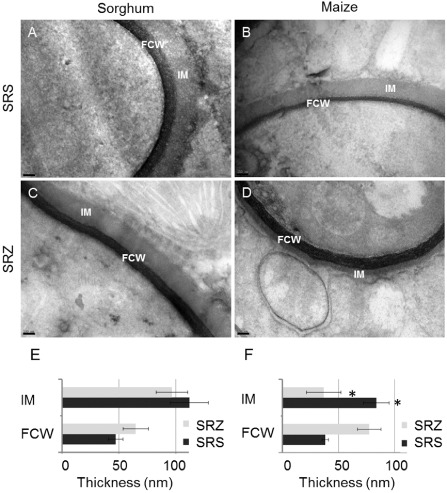
Figure 3.

Electron micrographs of sections obtained from sorghum (A, C) and maize (B, D) infected with S porisorium reilianum f. sp. reilianum (SRS) (A, B) or S . reilianum f. sp. zeae (SRZ) (C, D). Photographs show transverse cuts of fungal hyphae with black fungal cell wall (FCW) and grey interfacial matrix (IM). Measurements were performed for FCW and IM in sorghum (E, n = 10) and maize (F, n = 8). Error bars give the standard error of the mean (SEM); size bars, 100 nm.
