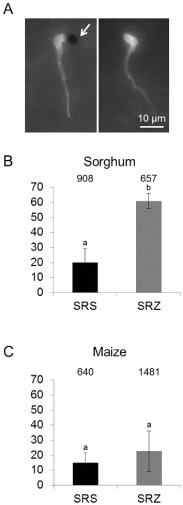
Figure 4.

H2O2 accumulation at S porisorium reilianum infection sites in maize and sorghum. Samples were collected at 1 day after inoculation (dai) and were stained with 3,3′‐diaminobenzidine (DAB) and calcofluor. (A) Examples of appressoria showing H2O2 deposition (left, white arrow) and without H2O2 (right). (B, C) Percentage of appressoria with H2O2 deposition for sorghum (B) and maize (C). Three biological replicates containing three to four plants each were analysed. Data given are the mean values and standard deviations. The total number of counted appressoria is indicated above the bars. Different letters above the columns indicate significant differences (t‐test with P ≤ 0.05).
