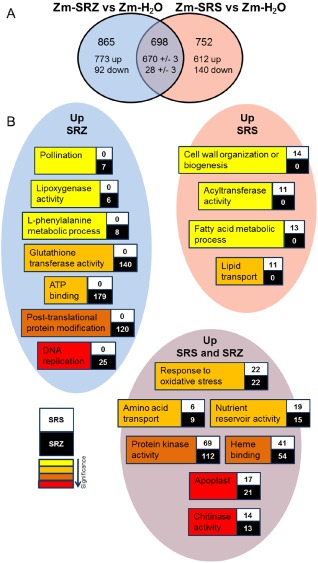
Figure 7.

Comparison of transcriptome analysis of maize leaves infected with S porisorium reilianum f. sp. reilianum (SRS) and S . reilianum f. sp. zeae (SRZ) vs. water control samples. (A) Venn diagram showing the distribution of genes differentially regulated (P ≤ 0.05) in the comparison of SRS‐infected samples vs. water‐inoculated control samples (Zm‐SRS vs. Zm‐H2O) and SRZ‐infected samples vs. water‐inoculated control samples (Zm‐SRZ vs. Zm‐H2O). (B) Examples of gene ontology (GO) terms up‐regulated by SRS, SRZ or both fungi when compared with water‐inoculated control samples. Boxes contain the number of genes induced by SRS (white box) or by SRZ (black box) belonging to each associated GO term. Background colours of the GO terms indicate significance according to the key.
