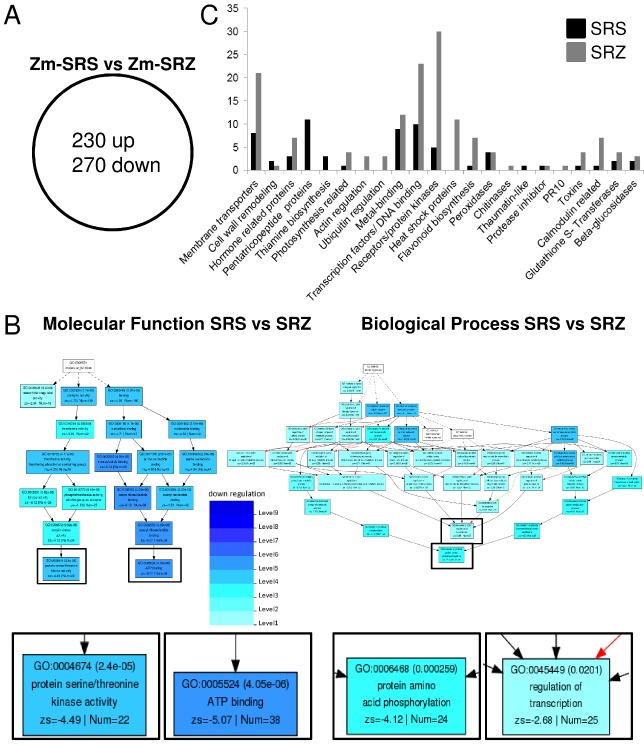
Figure 8.

Comparison of transcriptome analysis of maize leaves infected with S porisorium reilianum f. sp. reilianum (SRS) relative to S . reilianum f. sp. zeae (SRZ)‐infected samples. (A) Venn diagram showing the distribution of genes differentially regulated (P ≤ 0.05) in the comparison of SRS‐ with SRZ‐infected samples (Zm‐SRS vs. Zm‐SRZ). (B) Pathway mapping of the significantly enriched gene ontology (GO) terms in the comparison of Zm‐SRS vs. Zm‐SRZ showing the categories ‘Molecular function’ and ‘Biological process’. Four culminating GO terms are enlarged below for better readability. Boxes with GO terms have the GO ID, the false discovery rate (FDR), the GO term, the z score and the number of submitted maize genes belonging to the respective GO term. Background colours of GO terms indicate significance according to the key. (C) Summary of gene identity of differentially up‐regulated annotated genes of (A) in samples infected with SRS (black) and SRZ (grey). The graph shows the annotation and number of genes belonging to each function (212 genes are represented; complete gene lists are available in Tables S2 and S3, see Supporting Information).
