
Figure 1.
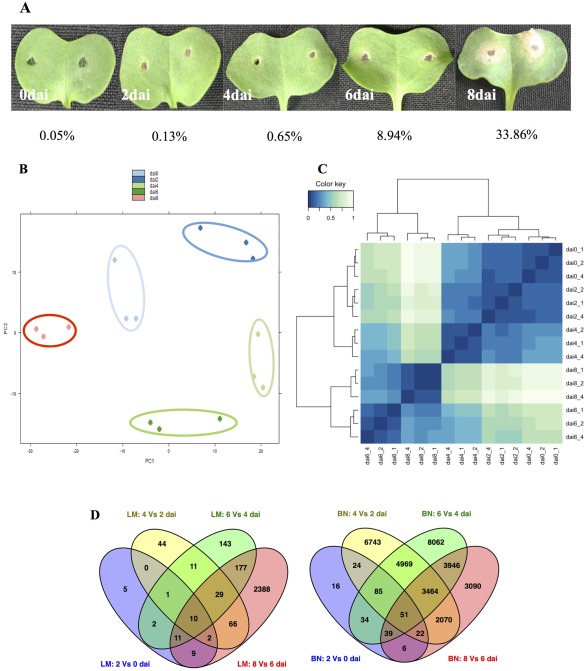
Disease symptoms on cotyledons of the susceptible Brassica napus cv. DH‐Topas 16516 (DHT) infected with Leptosphaeria maculans isolate 00‐100. (A) Cotyledons were photographed at 0, 2, 4, 6 and 8 days after inoculation (dai). The percentages of reads aligned to the genome of L. maculans isolate v23.1.3 for each time point are presented. (B, C) Global evaluation of RNA‐sequencing in L. maculans. Principal component analysis (PCA) (B) and clustering image map (CIM) (C) display a clear distinction among the transcriptome of L. maculans at different time points. (D) Differentially expressed genes (DEGs) that are unique or shared among various time point comparisons in 00‐100 (left, LM) and DHT (left, BN). The numbers of DEGs are noted in each section of the Venn diagrams.