
Figure 4.
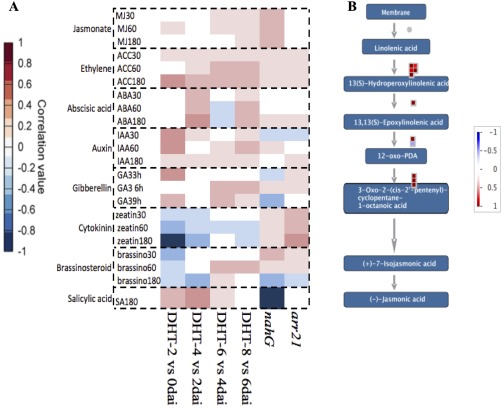
Brassica napus hormonal response to Leptosphaeria maculans infection. (A) A positive correlation between the query (B. napus differentially expressed genes) and the Arabidopsis thaliana genes expressed when treated with various plant hormones is denoted in red, whereas a negative correlation is represented by blue. The transcriptomes of the Arabidopsis mutants arr21 and nahg with increased cytokinin and decreased salicylic acid responses, respectively, are also included. (B) Jasmonic acid (JA) signalling pathway. MapMan output of JA‐related genes that were differentially expressed at 8 vs. 6 days after inoculation (dai) (≥log two‐fold change). Each square represents one gene. Intensity scale: red represents up‐regulated and blue represents down‐regulated genes.