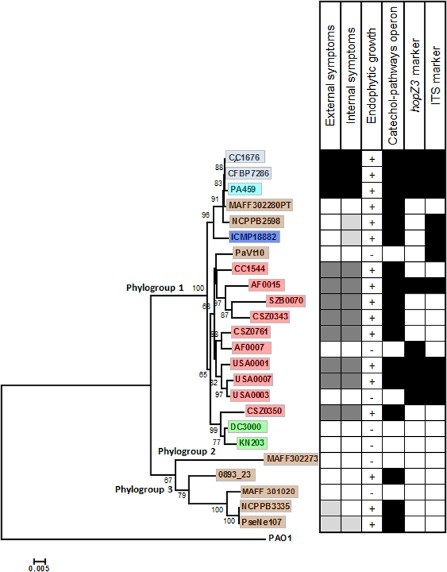
Figure 1.

Bayesian tree constructed on the concatenated sequences cts, gyrB, rpoD and gapA (1852 bp) of the strains tested for pathogenicity, endophytic growth and molecular markers. Bootstrap values are indicated at each node. External and internal symptoms are indicated with black boxes (severe disease), dark grey boxes (mild symptoms), light grey boxes (faint symptoms) and white boxes (no symptoms). The presence of the catechol operon involved in aromatic compound degradation, and of hopZ3 and ITS markers, is indicated by black (present) and white (absent) squares. For the catechol operon, all the genes were present for the positive strains. The origin of strains and their biovar affiliation are indicated with colour: light blue for Pseudomonas syringae pv. actinidiae (Psa) bv. 3, turquoise for Psa bv. 1, dark blue for Psa bv. 4, brown for strains isolated from woody hosts, green for strains isolated from herbaceous hosts and red for the environmental strains.
