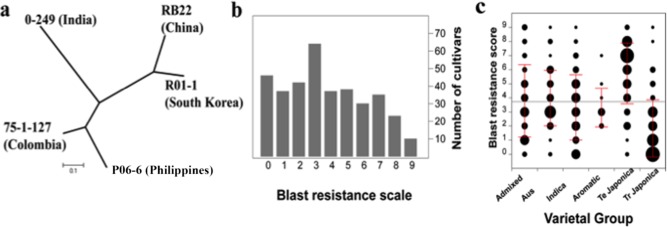
Figure 1.

Phylogenetic tree of the five blast isolates and distribution of blast resistance scores to R01‐1 in the rice diversity panel 1 (RDP1) and six subpopulations. (a) Phylogenetic tree of the five isolates constructed using 11 pairs of simple sequence repeat (SSR) markers (see details in Experimental procedures). (b) Distribution of blast resistance scores to isolate RO1‐1 in RDP1. (c) Distribution of blast resistance scores to isolate RO1‐1 in the six subpopulations. The area of the black circle represents the number of varieties and the red lines represent the standard deviation (SD) of the blast resistance scores. Te, temperate; Tr, tropical.
