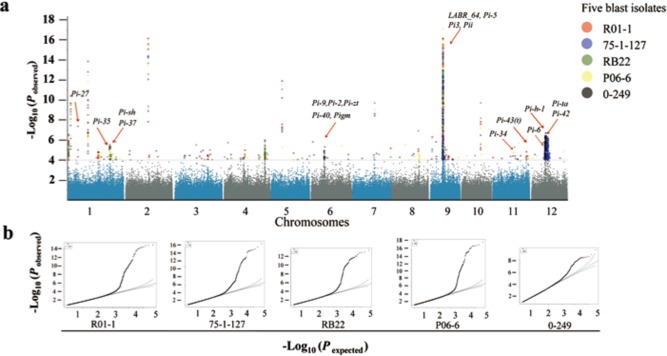
Figure 2.

Genome‐wide association scan for loci associated with blast resistance (LABRs) against five isolates using rice diversity panel 1 (RDP1). (a) The Manhattan plots of LABRs on 12 rice chromosomes. The genomic coordinates are displayed along the x‐axis and the logarithm of the odds (LOD) score for each single nucleotide polymorphism (SNP) is displayed on the y‐axis. The LOD score of each dot represents a transformed P value, –log10 P. The red arrows indicate that the identified LABRs are co‐localized with previously mapped or cloned resistance (R)‐gene regions. (b) Quantile–quantile (Q–Q) plots for the genome‐wide association results to the five isolates.
