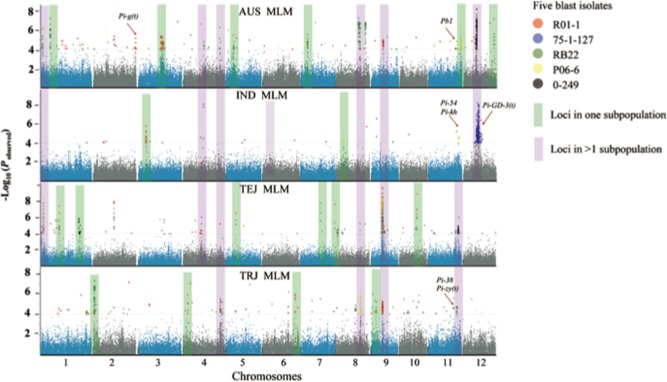
Figure 3.

Genome‐wide association scan of blast resistance across subpopulations to five isolates. AUS, aus; IND, indica; TEJ, temperate japonica; TRJ, tropical japonica. The coloured bands indicate the resistance‐associated regions. Purple‐coloured bands show the loci detected in at least two of the subpopulations. Green‐coloured bands show the loci only detected in one of the subpopulations. MLM, mixed linear model.
