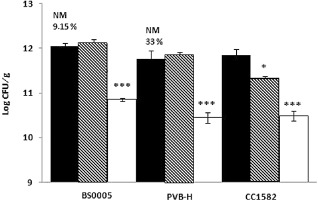
Figure 4.

Population density of the wild‐type (filled bars) and of mucoid (hashed bars) and transparent (open bars) variants during the disease assay on bean plants for strains BS0005, PVB‐H and CC1582. Population density was determined 7 days after inoculation. Standard errors are indicated for each mean. Statistically significant differences of the means between wild‐type and mucoid or transparent variants (NM) for the same strain are expressed as: *P < 0.05; ***P < 0.0005. Percentage values on the top of the bars indicate the total percentage of transparent variants of each strain. CFU, colony‐forming units.
