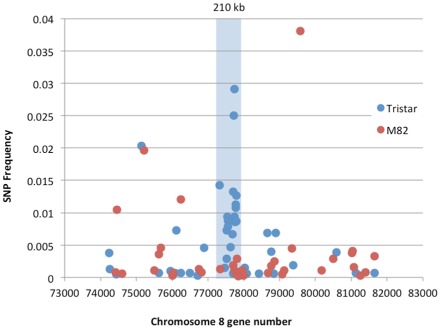
Figure 1.

Plot of single nucleotide polymorphism (SNP) frequencies for Tristar and M82 transcripts relative to the tomato reference transcriptome for genes on the long arm of chromosome 8. The SNP cluster corresponding to the introgressed region of S olanum pennellii DNA on Tristar chromosome 8 is highlighted in blue. SNP frequencies were calculated as the number of SNPs per transcript unique to Tristar or M82 divided by the length of the transcript.
