Figure 3.

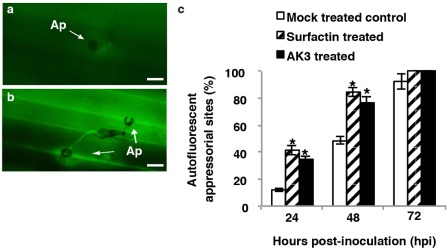
Representative epifluorescence images of mock‐treated control (a) and solid‐phase extraction (SPE)‐enriched surfactin‐treated (b) perennial ryegrass epidermal cells with attempted penetration sites of Magnaporthe oryzae conidia at 24 h post‐inoculation (hpi). Autofluorogenic phenolics are visible in cell wall appositions (CWAs), as well as in whole cells beneath appressoria. Treatment with AK3 live cells generated very similar images to those of the SPE‐enriched surfactin treatment. Bars, 20 μm. Ap, appressorium. (c) Frequency of autofluorogenic phenolic deposition at the attempted penetration sites of M. oryzae conidia on leaf epidermal cells in treated and mock‐treated perennial ryegrass leaves following inoculation with M. oryzae. Values represent the means ± standard deviation. The presence of an asterisk indicates a significant difference from mock‐treated control plants using Student–Newman–Keul's test (P < 0.05).
