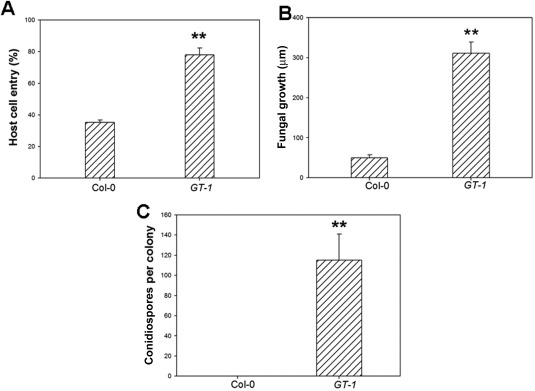
Figure 2.

Quantitative analysis of Oidium heveae HN1106 infection on wild‐type Col‐0 and Hevea brasiliensis GT‐1 leaves. (A) Quantitative assessment of host cell entry rates. Data represent the mean ± standard deviation (SD) of three experiments, each based on five to seven leaves per plant line. **Significant difference from Col‐0 (Student's t‐test, P < 0.01). (B) Quantitative analysis of hyphal growth of O. heveae HN1106 at 48 h post‐inoculation (hpi). Leaves were stained with Coomassie brilliant blue at 48 hpi, and hyphal lengths per colony were measured from photographs using mie 3.1 software. At least 10 colonies were measured for hyphal length. **Significant difference from Col‐0 (Student's t‐test, P < 0.01). (C) The numbers of conidiospores per colony were counted at 10 days post‐inoculation (dpi). Data represent the mean ± SD of at least 20 fungal colonies per plant line. **Significant difference from Col‐0 (Student's t‐test, P < 0.01). These experiments were repeated twice with similar results.
