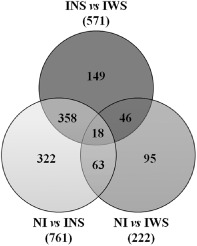
Figure 2.

Venn diagram of differentially expressed genes among the three comparisons performed (NI vs. INS, NI vs. IWS and INS vs. IWS). INS, inoculated leaves without symptoms; IWS, inoculated leaves with symptoms; NI, non‐inoculated GF305 peach leaves.
