
Figure 5.
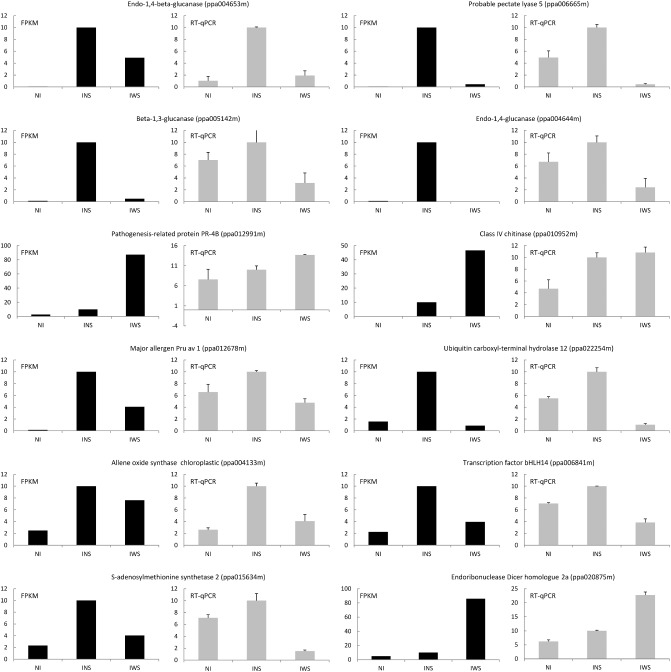
Validation of RNA‐Seq analysis by reverse transcription‐quantitative polymerase chain reaction (RT‐qPCR). FPKM (fragments per kilobase of exon per million fragments mapped) values obtained with RNA‐Seq and qPCR values in the analysis of selected genes in the three assayed samples: non‐inoculated control peach leaves (NI); PPV infected without sharka symptoms but ELISA and RT‐PCR positive (INS); and PPV infected with sharka symptoms and ELISA and RT‐PCR positive (IWS). Error bars represent the standard error for three independent experimental replicates.