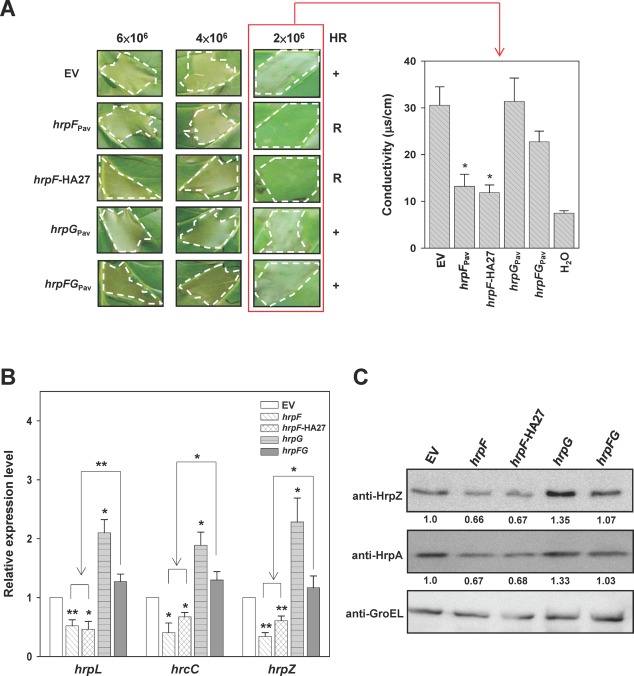
Figure 2.

Overexpression of HrpF showed negative effects on the hypersensitive response and Hrp expression. (A) Tobacco leaves were infiltrated at the indicated concentrations with Pseudomonas syringae pv. averrhoi HL1 (PavHL1) harbouring pBBR1MCS‐5 (EV), pNCHU1591 (hrpF Pav), pNCHU1810 (hrpF‐HA27), pNCHU1593 (hrpG Pav) or pNCHU1866 (hrpFG Pav), and photographed at 24 h post‐inoculation (hpi) for the hypersensitive response (HR, left panel). The ionic conductivity was assayed at 24 hpi (right panel) with the indicated inocula for quantitative analysis of cell death. +, wild‐type HR; R, reduced HR. The conductivity values were significantly different between PavHL1 (EV) and the strains overexpressing hrpF Pav or hrpF‐HA27 according to Student's t‐test (*P < 0.05). (B) Relative transcription of hrpL, hrcC and hrpZ in PavHL1 overexpressing hrpF Pav, hrpF‐HA27, hrpG Pav and hrpFG Pav at 6 hpi. The 16S rRNA was quantified and used for normalization by the comparative CT (cycle threshold) method, and the relative expression level was expressed as the fold change using the quantitative polymerase chain reaction (qPCR) result of PavHL1 carrying the empty vector as the denominator and those of PavHL1 expressing the target gene as the numerators. The error bars denote standard deviation (n = 3). Statistical analysis by Student's t‐test (*P < 0.05; **P < 0.01) was applied to compare the fold change of transcription between PavHL1 carrying the empty vector (EV) and various hrp‐expressing plasmids. (C) The production of HrpZ and HrpA in PavHL1 overexpressing hrpF Pav, hrpF‐HA27, hrpG Pav and hrpFG Pav was determined by immunoblot analysis at 6 hpi. GroEL was detected as a protein loading control, and the relative translations of HrpZ and HrpA in PavHL1‐derived strains are shown as fold changes in the banding intensity using the wild‐type as the denominator.
