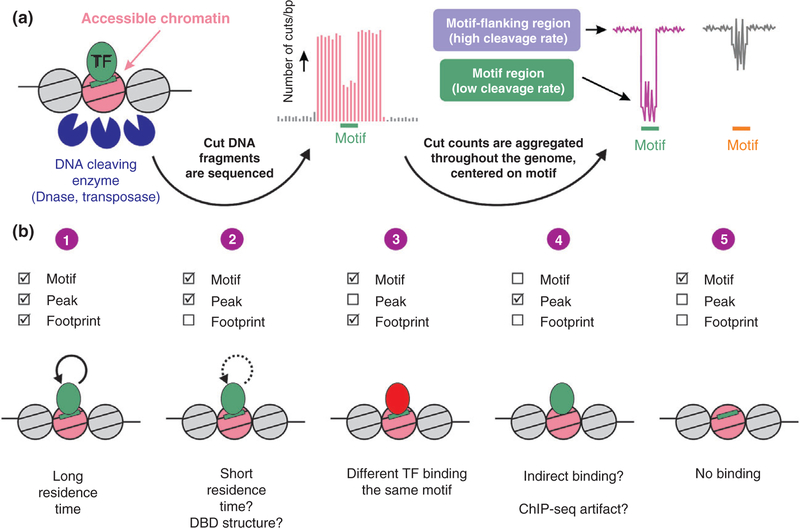
FIGURE 2.
Genomic footprinting. (a) The genome-wide accessibility of transcription factors (TFs) to their DNA motif sequences is measured via sequencing DNA liberated from the chromatin fiber by cleaving enzymes. In the resulting enhancer landscape map, regions bound by TFs can be locally protected and are thus less frequently cleaved. A motif-centered aggregate plot of cleavage events across the genome can present this reduced cleavage rate as a footprint (pink). However, some TFs do not leave a footprint although they measurably bind to DNA (grey). The zigzag pattern at the motif sequence (‘signature’) occurs regardless of TF binding and originates from enzyme cleavage bias. (b) Several scenarios arising by combining chromatin immunoprecipitation (ChIP-seq) and footprinting data. (1) The appearance of both a ChIP-seq peak as well as a footprint at the motif is the canonical case. (2) A lack of a footprint in bound sites is possible in highly dynamic TFs or in the case of a DBD structure that more readily allows DNase access. (3) A footprint at unbound sites can originate from another factor recognizing the same motif. (4) Peaks bound with no detectable motif (and therefore no footprint) can suggest indirect binding. (5) When the TF is inactive under the examined conditions, no footprint would be found. [Correction added on 10 November 2017, after first online publication: Figure 2b has been updated.]

