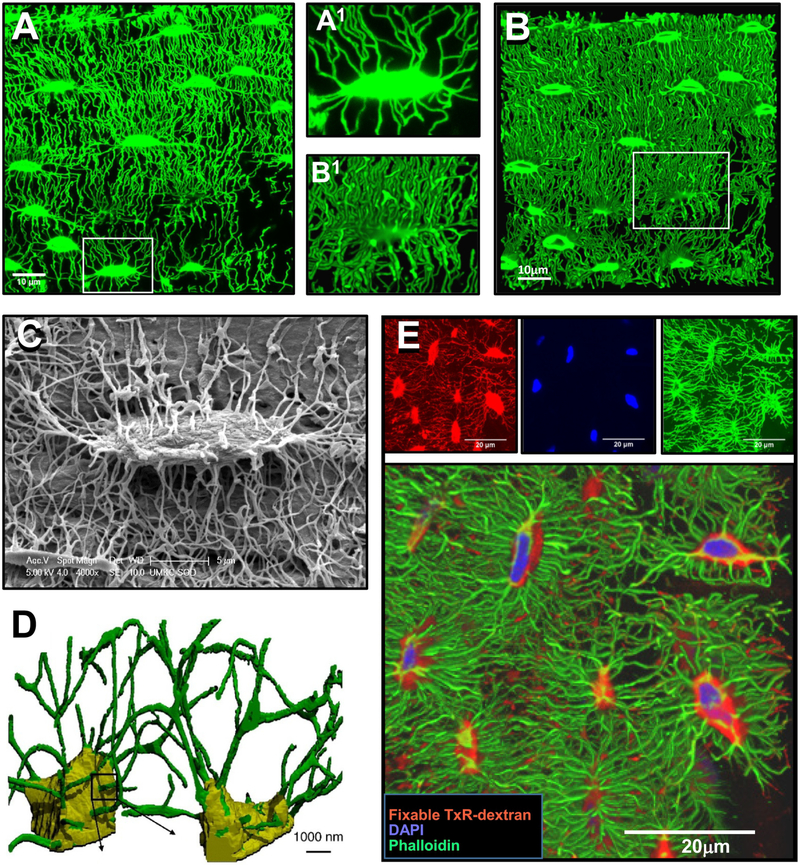
Figure 2: Methods for Imaging Osteocytes and the Lacunocanalicular System.
A) Confocal image of FITC stained, undecalcified mouse femur, showing the lacunocanalicular system (maximal Z-projection, 40 planes with 0.126 μm Z plane separation, 100x oil objective, 1.7x digital zoom). The image in A1 shows an enlarged image of the boxed area in A), bar = 10μm. B) 3D rendered view of the lacunocanalicular system shown in A) (250 planes, 0.126 μm Z plane separation), bar = 10μm. The image in B1 shows an enlarged image of the boxed area in B). C) Acid-etch resin embedded SEM image of an osteocyte lacuna and its canaliculi, bar = 5μm. D) 3D representation of osteocyte lacunocanalicular networks imaged using serial FIB/SEM with the lacunae indicated in yellow and the canaliculi indicated in green, bar = 1μm. E) Multiplexed confocal imaging of osteocytes and their lacunocanalicular system in mouse femur using combined staining with phalloidin, DAPI and fixable Dextran. Top row shows maximal Z-projected confocal images of fixable Texas Red-Dextran [red] to show the lacunocanalicular network, DAPI [blue], to show the nuclei and alexa fluor 488-phalloidin [green], to show the actin cytoskeleton of the osteocytes (50 planes with 0.13μm Z plane separation, 100x oil lens, 1x digital zoom). Lower panel shows a 3D rendered view of the same field (242 planes 0.13μm Z plane separation). Note that the labeling of the lacunae with fixable dextran (red) extends out beyond the limits of the osteocyte cell body and that the dendrites can be seen to traverse across the lacunar space, bar = 20μm. Panel D) is reprinted from Schneider et al. 2011 [42] and panel E) is modified and reprinted from Kamel-ElSayed et al. 2015 [47] with permission.

