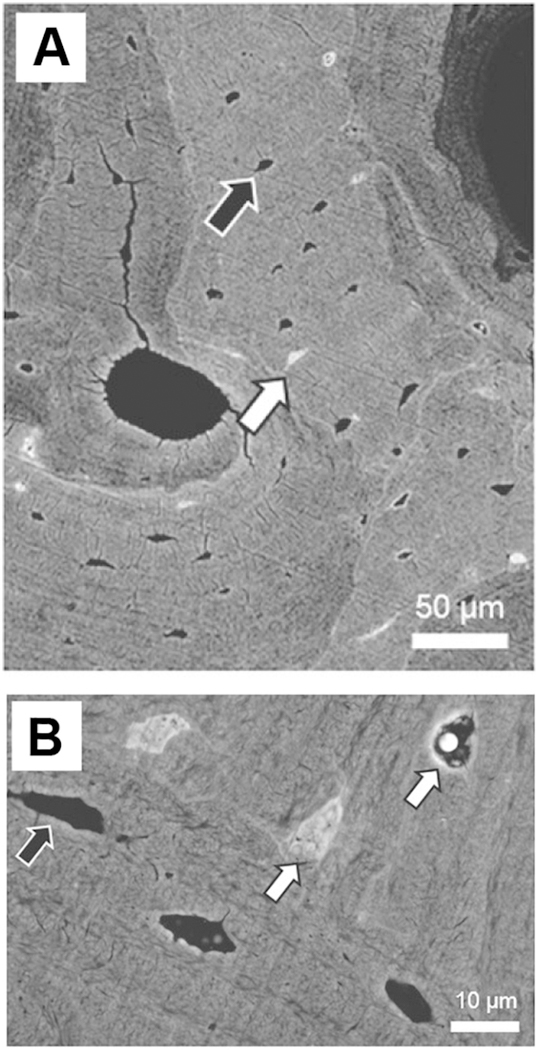
Figure 3: Micropetrosis of Osteocyte Lacunae in Aged Mice.
A) Backscattered SEM image of aged human osteoporotic bone showing normal osteocyte lacunae (black arrow) and mineralized micropetrotic lacunae (white arrow), bar = 50μm. B) Higher power backscattered SEM image showing normal (black arrow) and mineralized (white arrow) lacunae, bar = 10μm. The micropetrotic lacunae are hypermineralized compared to the surrounding matrix and therefore appear lighter than the surrounding matrix. Panels A) and B) are reproduced from figures 3 and 1, respectively, from Milovanovic et al, 2017 [78] with permission.

