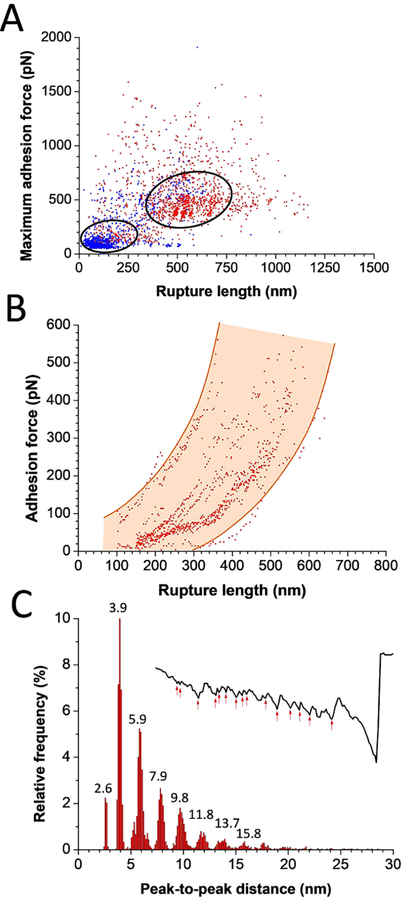
Figure 3.
Detailed analysis of Als5—Als5 sawtooth force profiles. (A) Scatter plots of the maximum adhesion forces versus rupture length for Als5—Als5 cell pairs (in red, n = 1329 curves from 9 cell pairs) and Als5V326N—Als5 cell pairs (in blue, n = 1091 curves from 14 cell pairs). (B) Scatter plot of the adhesion force versus rupture length of all peaks estimated from Als5—Als5 force profiles (868 data points). (C) Distribution of peak-to-peak distances estimated from Als5—Als5 force profiles (n = 4791 peaks from 7 cell pairs). Inset: a representative force—distance curve with multiple peaks marked.

