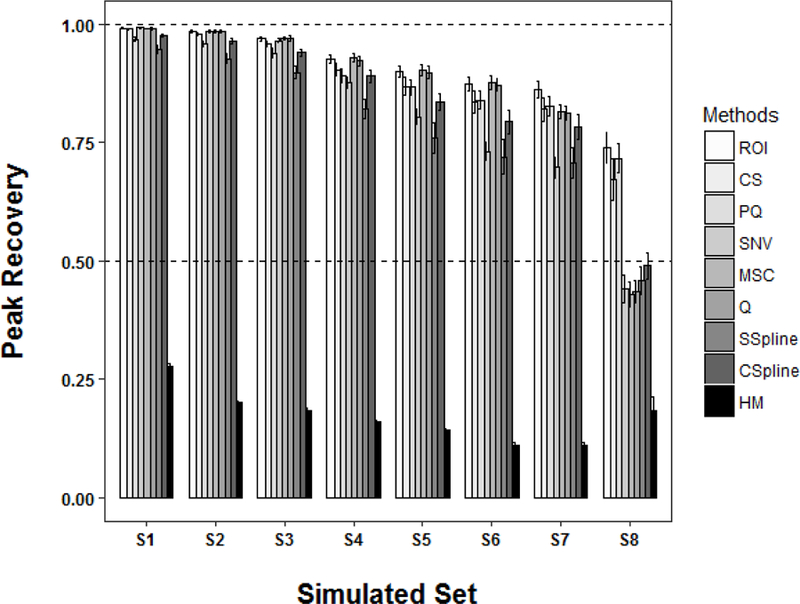
Figure 2.

A plot of the recovery of peak intensities (eqn. 3) for the 9 normalization methods after being applied to the 8 (S1 to S8) simulated datasets listed in Table 1. The total signal variance due to the amount of added Gaussian noise and the magnitude of the dilution factor increases from S1 to S8. The horizontal dashed lines represent a full recovery at 100% and partial recovery at 50%. Each bar represents the mean peak recovery and the error bars represent ±2*standard error of the mean.
