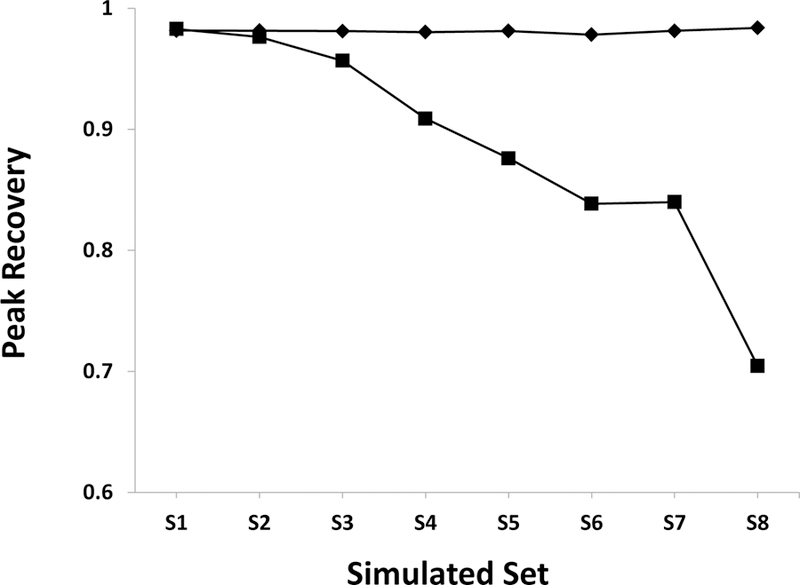
Figure 4.

A plot of the average peak recovery calculated from the three top-performing normalization methods (CS, PQ, and ROI). Datasets were regenerated according to the scheme described in Table 1 but containing only a dilution factor (♦) or the addition of Gaussian noise (■). The dilution factor or added Gaussian noise was held constant at S1 values when the other parameter was varied. The peak recovery decreases with additive noise, but is unaffected by dilution factor.
