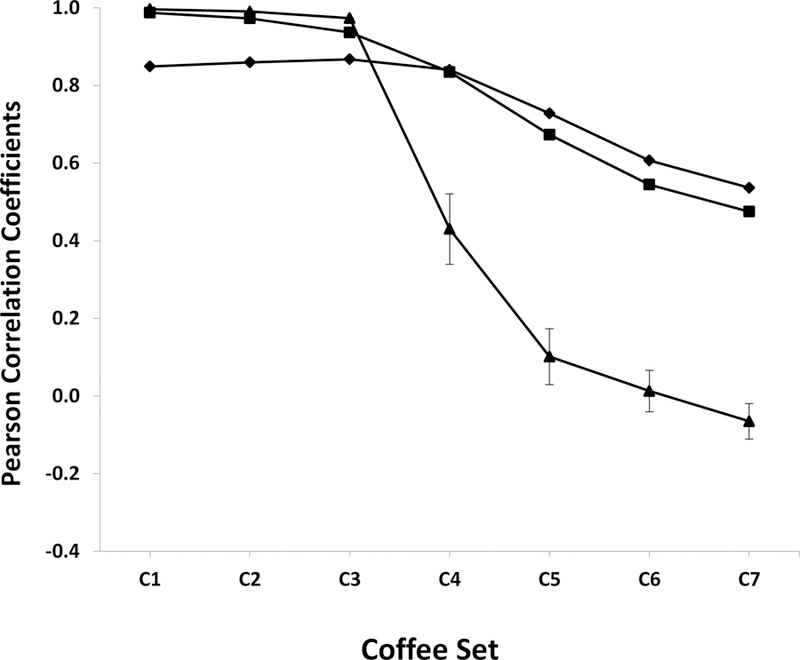
Figure 5.

A plot of the average Pearson correlation coefficients (eqn. 4) calculated by comparing the true backscaled loadings from the original coffee dataset OPLS-DA model relative to the backscaled loadings from the CS (♦), PQ (■), and ROI (▲) normalized coffees noisy dataset OPLS-DA model. The amount of signal variance introduced into the coffees dataset is described in Table 2. The error bars represent ±2*standard error of the mean. Please note that most of the error bars are smaller than the size of the symbols.
