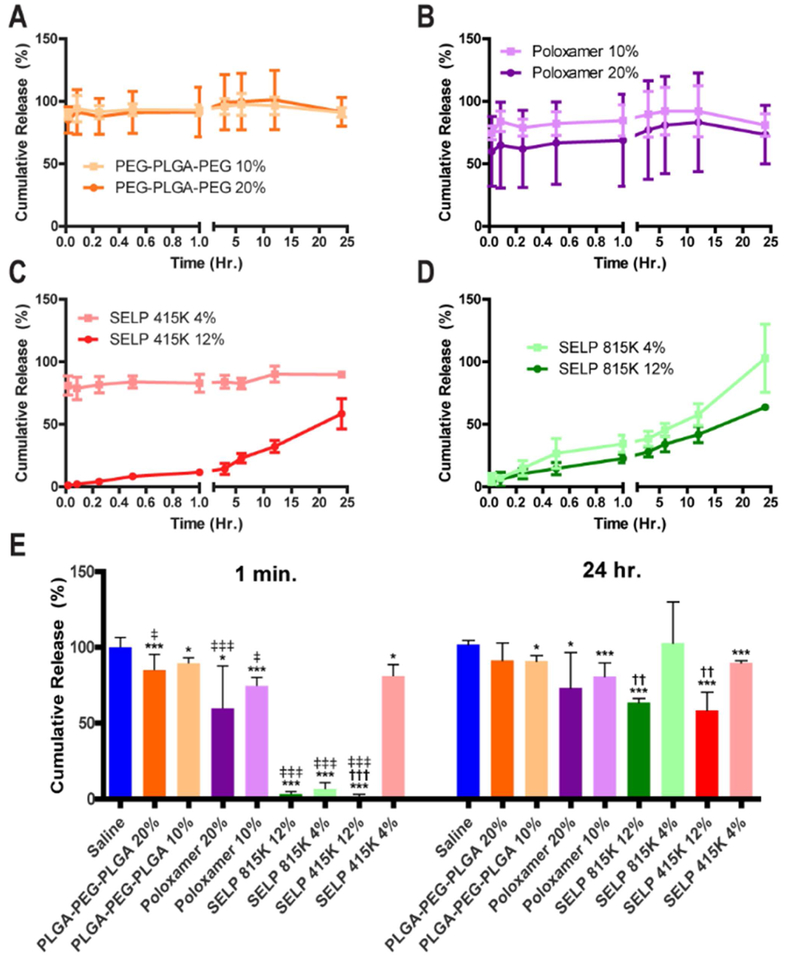
Figure 2: Cumulative release of SAGE from different thermoresponsive polymer gels at varying concentrations.
The plots for A) PLGA-PEG-PLGA, B) Poloxamer 407 (Pluronic F127), C) SELP 415K, and D) SELP 815K show the release profile for each structure at a high and low concentration. E) The chart showcases the instantaneous release and cumulative release after 24 hours for each test group demonstrating the distinct advantage of SELPs for the controlled release of SAGE between the synthetic polymers and the recombinant SELP systems. * and *** indicate p-values of less than 0.05 and 0.001 when sample is compared to the PBS control. †† and ††† for comparison of the high and low concentrations polymer indicates p-values of less than 0.01 and 0.001, respectively. ‡, ‡‡, and ‡‡‡ indicate a p-value between the 1 min. and 24 hr. time points of 0.05, 0.01, than 0.001 or less, respectively. Statistical comparisons performed with a 1 way ANOVA followed with a Bonferroni Post Test with a sample size of 6 for each test group. All error bars indicate the standard deviation.

