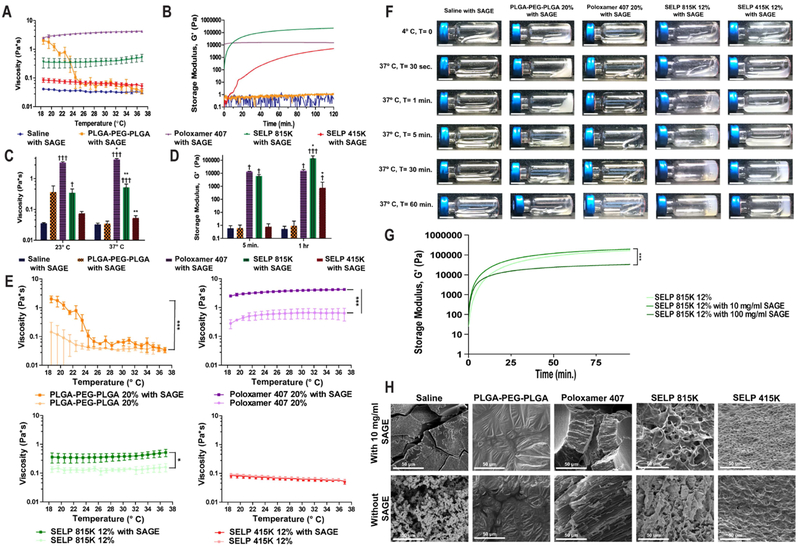
Figure 3: Polymer solutions maintain injectable profiles and gelation after the incorporation of SAGE.
A) Viscosity profile of SAGE containing polymer solutions over a temperature range simulating a typical intravesical administration. B) Rheology trace of polymers over a 2-hour period demonstrates the distinct difference between SELP 815K, SELP 415K, Poloxamer 407, and PLGA-PEG-PLGA gelation profiles. C) Comparison of polymer solution viscosity at room and physiological temperatures. * indicates statistically significant differences between the viscosity at 23° and 37° C. † indicates statistical differences between the saline and polymer solutions. D) Gelation over time was observed in the SELP samples but not either of the synthetic polymers or saline control. * indicates statistically significant differences between the modulus at 5 min. and 1 hr. † indicates statistical differences between the saline and polymer solutions. E) Viscosity traces showing that 10 mg/ml SAGE increases the viscosity of the polymer solutions, but the degree of impact varies by temperature and polymer type. F) Images of polymer solutions in HPLC vials over time visually demonstrating gelation kinetics for each of the solutions. The scale bar represents 1 cm. G) A rheology trace showing the impact of adding 10 mg/ml and 100 mg/ml SAGE to SELP 815K 12% solutions on gelation. H) SEM images of lyophilized polymers after 24 hr. at 37° C, demonstrating SELP network formation. Statistical comparisons performed with a 1-way ANOVA followed with a Bonferroni Post Test. All points indicate the mean of 3 independent samples and error bars indicating the standard deviation.

