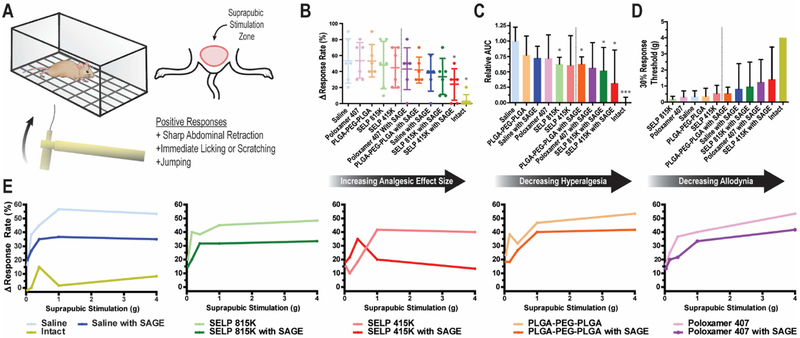
Figure 6: Behavioral assessment of suprapubic pain in murine IC/PBS model after SAGE administration.
A) Graphical depiction of Von Frey filament testing of bladder pain via suprapubic stimulation. B) The change in response rate for mice from baseline at the 4 g stimulation level. Each dot represents the individual mouse (n=6). Dashed line shows the demarcation between groups that did or did not receive SAGE. Intact mice were not subjected to LL-37 insult. C) Area Under the Curve (AUC) of the response curve after the subtraction of baseline response rates for each animal normalized to the saline, sham treatment, group (n=6). D) Plot showing treatment effects on allodynic response based on the level of stimulation needed to increase positive response rate from baseline by 30%. None of the 6 mice from the intact group exceeded the 30% response threshold, so the maximum stimulation of 4 g is shown for reference. All plots are of the mean with error bars representing the standard deviation when included. The dashed line shows the clear demarcation between groups that did or did not receive SAGE. E) Traces of the increased positive response rate from baseline for mice (n=6) 24 hours after LL-37-induced IC/PBS model and treatment with polymer solutions with or without 10 mg/ml of SAGE. * and *** indicate a p-value of less than 0.05 or 0.001 when compared to the saline control group, respectively, as determined by a 1-way ANOVA with Bonferroni Post Test. Each experimental group contained 6 animals.

