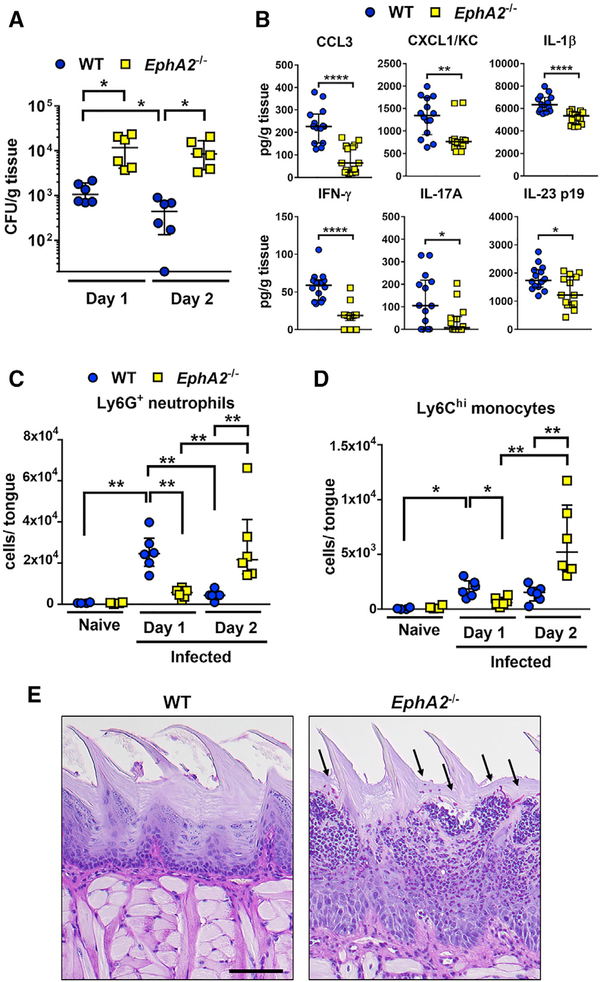
Figure 1. EphA2 Signaling Orchestrates Early Phagocyte Recruitment during OPC.
(A) Oral fungal burden of immunocompetent wild-type and EphA2−/− mice after 1 and 2 days of OPC. Results are median ± interquartile range of six mice per group from two independent experiments. *p < 0.05 (Mann-Whitney test corrected for multiple comparisons). The y axis is set at the limit of detection (20 colony-forming units [CFUs] per gram of tissue).
(B) Level of chemokines and cytokines in the tongue homogenates of immunocompetent wild-type and EphA2−/− mice with OPC after 1 day of infection. Scatterplots show median and interquartile range of seven mice in each group, tested in duplicate in two independent experiments. *p < 0.05, **p < 0.01, ****p < 0.0001 (Mann-Whitney test corrected for multiple comparisons).
(C and D) Myeloid phagocyte infiltration in tongues of immunocompetent wild-type and EphA2−/− mice after 1 and 2 days of infection (n = 6 for infected mice, n = 4 for naive mice). Results are median ± interquartile range from combined results of two independent experiments. *p < 0.05, **p < 0.01 (Mann-Whitney test corrected for multiple comparisons). See Figure S1 for the gating strategy during flow cytometric analysis.
(E) Histopathology of the tongue of wild-type and EphA2−/− mice with OPC after 2 days of infection. Scale bar, 100 μm. Results are representative of 2 mice from the same experiment. Arrows indicate the C. albicans cells.

